How do wet and dry years affect corn yield and nitrate leaching under different irrigation and nitrogen management strategies?
By: Vasudha Sharma, Extension irrigation specialist and Andrea Elvir Flores, Graduate research assistant
The number of irrigated acres in Minnesota is increasing as more and more growers look for ways to ensure high crop yields during dry years. This blog post provides an update on a field research study being conducted at two irrigated corn sites in Minnesota’s central sands region. After three years of data at one of the sites, we’ve seen some interesting results on how a reduced irrigation strategy could save water and reduce nitrate leaching, saving farmers money and benefiting the environment.
Why do this research?
In Minnesota, irrigation is common in the central region of the state and a necessary practice for the success of numerous crops such as corn, soybeans and potatoes. However, the lack of precise irrigation recommendations for Minnesota soils and production systems raises concerns about the impact of irrigation on ground and surface water resources and quality. High rates of groundwater withdrawals for irrigation can damage nearby lakes and streams, thus impacting aquatic lives and recreational activities. Additionally, nitrate leaching into groundwater poses a threat to groundwater quality for drinking. Proper irrigation and nitrogen (N) fertilizer management for crop production is necessary to protect water quality and use water resources efficiently.Globally, the United States is the largest corn producer, with more than 93 million acres cultivated annually. Minnesota is one of the top four corn producer states and these states together produce 50% of the country’s corn. Consequently, corn is the primary U.S. feed grain and Minnesota’s second largest ag export commodity. An average of 8.4 million acres are planted with corn annually in Minnesota, where the current average corn yield in the state is 178 bushels per acre. Climate change and drought are major factors for crop failure for Minnesota corn growers, especially on central Minnesota’s sandy soils. Therefore, every year more farmers adopt irrigation to maximize yield and assure a successful growing season.
With the increase in irrigated land comes an increased pressure on the quantity and quality of Minnesota’s water resources. To mitigate this impact, several restrictions are in place in terms of obtaining irrigation permits, drilling new wells, and the allowed amount of irrigation. In order to follow these guidelines and restrictions, different advanced irrigation practices are being introduced to Minnesota’s growers, and several research studies are taking place to adapt these practices to the specific needs of the state. Previous studies in other regions of the U.S. have shown that crop water productivity varies with varying rates of N and irrigation. Under reduced irrigation rates, N fertilizer must be correspondingly adjusted to optimize economic crop production. Hence the need for this research that focuses on determining the best combinations of irrigation and N fertilizer to minimize environmental impacts while maximizing yield and profitability.
Where is this study conducted?
A field research study is being conducted at two locations in central Minnesota: the Sand Plain Research Farm in Becker, Minnesota, and the Rosholt Research Farm in Westport, Minnesota. Both sites are situated in the heart of Minnesota’s irrigated acres. The funding is being provided by the Agricultural Fertilizer Research and Education Council (AFREC).The main goal of this research is to investigate the interaction of different irrigation and N rates on nitrate leaching, corn yield, and water and N use efficiency in coarse-textured soils to develop best management practices aimed at creating resilient agricultural systems that optimize corn production and groundwater usage and minimize nitrate leaching. This project is evaluating the effect and interaction of four irrigation levels and six nitrogen rates (0, 70, 140, 210, 280 and 350 lb/ac) on corn production and nitrate leaching. The four irrigation levels are:
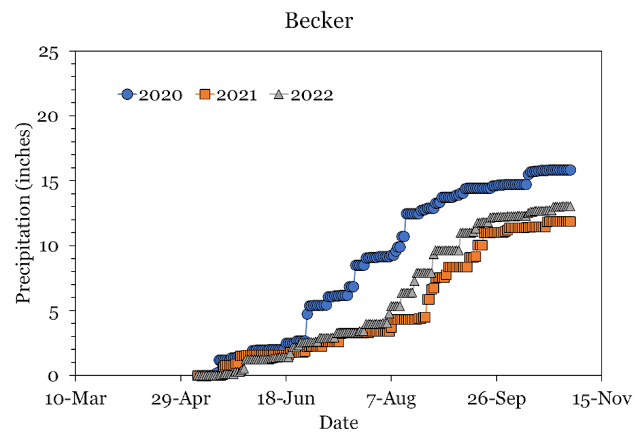
The three growing seasons were very different from each other in terms of precipitation. All three years experienced growing season precipitation less than the long-term average (22 inches). During the 2020 growing season, the site received 16 inches of precipitation while 2021 and 2022 received 12 inches and 13 inches, respectively (Figure 3). However, in 2020, the precipitation received in June, July, and August (the three primary months for crop growth) was one inch above the long-term average for those months. In 2021 and 2022, precipitation was 6 and 4 inches below the long-term average for those months. For this reason, we considered 2020 a wet year and 2021 and 2022 as dry years in this study.
In regards to irrigation application, in our 100% irrigation plots, we applied 7, 13, and 6 inches in 2020, 2021 and 2022 respectively (Figure 4). Lower irrigation in 2022 than in 2020 can be attributed to two reasons: very timley small rainfalls in June and July and very high precipitation received in August 2022. This suggests that irrigation application rates depend not just on the cumulative growing season precipitation received but also on the timing of precipitation.
On average, the highest yielding treatments were:
In conclusion, three years of data suggest the benefits of a reduced irrigation strategy for water savings and reduced nitrate leaching in the central sands region of Minnesota, though more data from this ongoing study will refine our conclusions. With more years of data, we plan to develop functions for corn yield and evapotranspiration characteristics, evaluate the effect of reduced irrigation management in interaction with N supply for corn, and analyze water and nitrogen use efficiency for corn for central sands region of MN.
- Full irrigation (FI), i.e., imposing no water stress on the crop (100%)
- 75% of FI
- 50% of FI
- Rainfed conditions
What are we measuring?
The evaluated variables consist of corn yield, nitrate leaching, soil moisture, plant nutrient status, and several soil parameters. Nitrate leaching is determined using permanent suction cup lysimeters (at a depth of 4 feet) which are sampled every week. Soil moisture is monitored weekly using a Neutron Moisture Gauge from 0 to 4 ft depth, to estimate irrigation requirements, crop evapotranspiration, and drainage. Plant samples are collected at V8, R1, and R6 growth stages to determine total N uptake. Additionally, proximal and remote sensing data is being collected using a wide range of in-season non-destructive technologies such as unmanned aerial vehicles (UAVs) and leaf sensors.
Data from the 2020, 2021, and 2022 corn growing seasons at Becker, MN
Precipitation and irrigation
 |
| Figure 2. Graduate research assistant Andrea Elvir Flores collects soil moisture data, and installs lysimeters at the research site. |
In regards to irrigation application, in our 100% irrigation plots, we applied 7, 13, and 6 inches in 2020, 2021 and 2022 respectively (Figure 4). Lower irrigation in 2022 than in 2020 can be attributed to two reasons: very timley small rainfalls in June and July and very high precipitation received in August 2022. This suggests that irrigation application rates depend not just on the cumulative growing season precipitation received but also on the timing of precipitation.
 |
| Figure 3. Cumulative growing season precipitation in 2020, 2021, and 2022 at Becker, MN. |
 |
| Figure 4. Total irrigation application amount in 100%, 75%, 50% and rainfed plots in 2020, 2021 and 2022 growing seasons at Becker, MN. |
Yield response to irrigation and nitrogen
Irrigation and nitrogen are two factors of corn production. Equations relating productivity to levels of factors of production are useful not only in clarifying agronomic response but also in establishing economic relationships. We found a significant response of corn yield to N rate from three years of data. Yield response to nitrogen was curvilinear over the treatment range, meaning with the increase in N rate, the crop yield increases and then plateaus or decreases at a higher N rate (Figure 5). The response of corn yield to irrigation in 2020 was insignificant due to sufficient precipitation. Irrigation and nitrogen interaction was significant in 2021 and 2022. For three years of combined data, we found that increasing increments of applied irrigation water resulted in curvilinear corn yield response at all nitrogen levels except the 0 N rate (Figure 6). Yield responses to both increases in N and irrigation indicate that high availability of water and/or N resulted in excessive vegetative development, which reduced yield.On average, the highest yielding treatments were:
- 222 bu/ac with 75% irrigation at 280 lb N/ac in 2020
- 226 bu/ac at 100% irrigation and 280 lb N/ac in 2021
- 226 bu/ac at 100% irrigation and 280 lb N/ac in 2022
 |
| Figure 6. Corn yield response to total water input at different N rates at Becker, MN. N1, N2, N3, N4, N5 and N6 are 0, 70, 140, 210, 280, 350 lb N/ac, respectively. |
Nitrate leaching
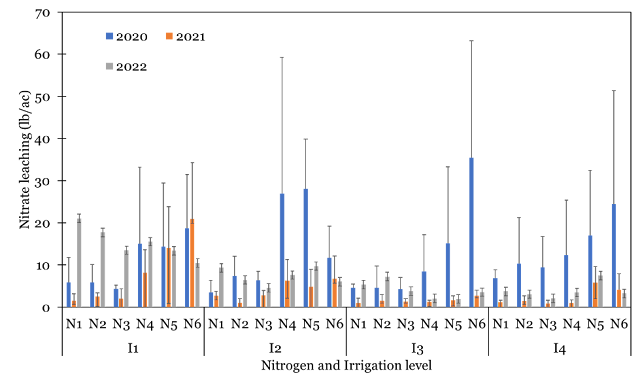
Figure 7 shows the impact of total water application on nitrate leaching in 2020, 2021, and 2022. Nitrate leaching was highest in 2020 because of heavy rains during the growing season. We did not see any significant response of nitrate leaching to an increase in total water input in the wet year 2020 (Figure 8). However, in dry years 2021 and 2022, we found that nitrate leaching is highest at lower water input rates, decreases as the total water input increases, and then increases again at higher water input rates (figure 8), indicating the effect of water input on nitrate leaching, particularly in dry years.
This research is funded by the Agriculture Fertilizer Research and Education Council (AFREC), the Minnesota Department of Agriculture, and the Irrigators Association of Minnesota.
---
For the latest nutrient management information, subscribe to the Nutrient Management Podcast wherever you listen and never miss an episode! And don't forget to subscribe to the Minnesota Crop News daily or weekly email newsletter, subscribe to our YouTube channel, like UMN Extension Nutrient Management on Facebook, follow us on Twitter, and visit our website.
For the latest nutrient management information, subscribe to the Nutrient Management Podcast wherever you listen and never miss an episode! And don't forget to subscribe to the Minnesota Crop News daily or weekly email newsletter, subscribe to our YouTube channel, like UMN Extension Nutrient Management on Facebook, follow us on Twitter, and visit our website.
Support for nutrient management blog posts is provided by Minnesota's fertilizer tonnage fee through the Agricultural Fertilizer Research & Education Council (AFREC). Learn more at MNsoilfertility.com.


Comments
Post a Comment